Dissecting Google Analytics Reports: Technology and Mobile Usage
December 2, 2014

CONSUME CREATIVELY
This content is available in:
This content is available in:
TEXT
Here we are at the end of our Dissecting Google Analytics Reports blog series. In this fifth and final installment of the series we want to share some insights about the technology people use to view your website.
If you’ve synced your site up with Google Analytics you have the ability to answer questions like:
- How are visitors viewing my website?
- What program do viewers use to see my website?
- Are any browsers causing errors?
- What device do viewers use to see my website?
- Do I need a mobile site?
Locate Your Technology and Mobile Users Report
Once you’ve logged in to your Google Analytics account make your way over to the menu bar and navigate down to the Audience tab. By clicking on Technology and then Browser & OS you will see the report detailing the various browsers your visitors use to access your site. Within the Audience tab you can also click on Mobile to either see visitor breakdown by device category (Overview) or specifically see which mobile devices visitors are using to access your site (Devices).
Remember to adjust the time span for your report to reflect the period you are interested in reviewing data for.
Technology
The purpose of the technology report presented by Google Analytics is to help you determine how your visitors are viewing your site. What browsers are they finding you in?

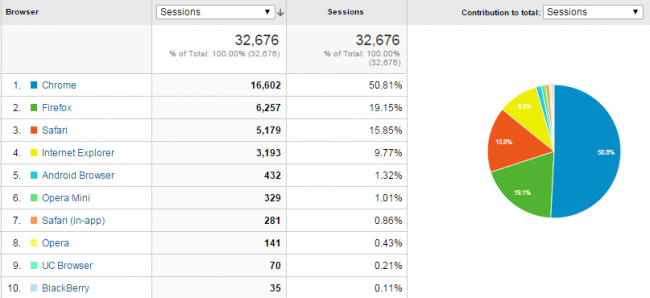
As you can see from our report, Chrome, Firefox and Safari are the top three browsers used to view our site. Early adopters (consumers who are first in line to use new technology) tend to use Chrome and Firefox browsers. It makes sense that almost 70 perfect of our visitors uses these two browsers because MayeCreate offers web design and online marketing services that require new age technology.
Considering that many local college students use Safari (Mizzou journalism kids are crazy about Apple products) it’s logical to see that 15.85 percent of our visitors view our website with Safari.
Why do I need to know which browsers my visitors are using?
Knowing which programs viewers use to see your website is important because you will then know which browsers are crucial to check for proper display. Sometimes certain browsers cause errors; the way a website displays in Chrome may be a little bit different than it displays in Safari. Taking the time to ensure your website works appropriately in popular browser will help to confirm an enjoyable user experience thus lowering your bounce rate.
If you notice atypical data for a particular browser, like extremely high bounce rates or low session durations, this may be an indication that your site isn’t displaying properly in that browser.
Mobile
The Mobile section of your Google Analytics report offers insights about what devices people are using to see your site and can help you determine if it would be beneficial to have a responsive, or mobile-friendly, version of your site.
This report can also help you deduct where people are viewing your site from. For instance, a high percentage of visitors from a desktop indicates that visitors were probably accessing your site while at home or at work. The statistics related to mobile device usage likely means visitors were on your site while on the go. Take this into consideration when evaluating your numbers.
Mobile Overview

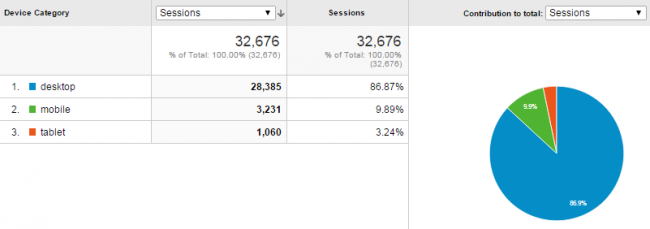
A good rule of thumb is that if mobile viewers make up over 25 percent of your audience you may want to consider creating a mobile site. Take a look at how mobile users interact with your website and compare those results to the overall numbers on the Audience Overview page. Identify problem areas by asking yourself:
- Are mobile bounce rates HIGHER than overall bounce rates?
- Are mobile pages/session LOWER than overall pages/session?
- Are mobile session durations SHORTER than overall session durations?
If you answered yes to all three of these questions, chances are you could benefit from developing a mobile site. Visitors may be bouncing off of your site at a higher rate and leaving the site sooner when visiting from a mobile device because the site doesn’t display well on their phone or tablet. Adjusting the site to optimize on mobile could improve your results.
Mobile Devices

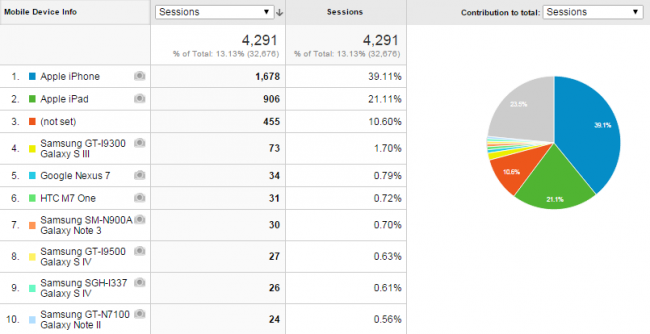
This might sound creepy, but Google Analytics knows exactly which mobile device a visitor is using to access your website. From here you can figure out what content is most appealing to visitors based on their mobile device by sorting for Landing Page. You can add “Landing Page” as a secondary dimension by clicking on Secondary dimension, Behavior and then Landing Page. Try to determine if mobile visitors come to your site to read blog posts or if they just want your contact information.
For those of you who are curious about secondary dimensions this feature of your Google Analytics report allows you to analyze your data in a more specified way. By adding a secondary dimension to your report you can further describe or characterize your data to learn more about your website visitors.
Technology Observations
Based off of our technology and mobile usage reports we were able to draw the following conclusions:
- Our viewers are likely accessing our site while at work.
- We don’t have enough mobile traffic to warrant a mobile site (13.13 percent of our users come from mobile devices). Nevertheless, our website is optimized for mobile to accommodate those who do visit our site from their phones and tablets.
- Session duration and pages per session are lower on mobile devices. We need to investigate what those pages are to determine if and where we need to work on the site’s mobile display.
- iPhones and iPads access our site more often than any other mobile device. This means that our website is optimized well for mobile and the display on these devices is user friendly.
I encourage you to try to develop critical observations like these based on your data-set so you can reap the benefits of the time spent reviewing your analytics.
Dissecting Google Analytics Reports Blog Series
If you’re interested in more support with your Google Analytics reports, the links below will direct you to the other articles in our Dissecting Google Analytics Reports blog series.
- What you can Learn from Behavior Flow
- Traffic Sources
- New vs. Returning Visitor Frequency & Engagement
- Location
Thanks for tuning in!
[hs_action id=”9230″]
Who Manifested This Madness?

This fabulous human, that's who.
Monica Maye Pitts
Monica is the creative force and founder of MayeCreate. She has a Bachelor of Science in Agriculture with an emphasis in Economics, Education and Plant Science from the University of Missouri. Monica possesses a rare combination of design savvy and technological know-how. Her clients know this quite well. Her passion for making friends and helping businesses grow gives her the skills she needs to make sure that each client, or friend, gets the attention and service he or she deserves.


