Digging into Data Part 2 – Reviewing Social Media Data
May 20, 2020

CONSUME CREATIVELY
This content is available in:
This content is available in:
AUDIO
TEXT
WHOA NOW. Are you ready for part 2 of our Digging into Data Series? We hope you’re enjoying this data deep dive as much as we are. In this podcast, we are reviewing social media data! We’re covering what you should review, the tools you can use to make it easier, how to interpret those tricky social metrics, and how often you need to review it. Social media isn’t just for millennials, we should all understand if it’s working or not!
Welcome to the second part of our Digging into Data series, how to review social media data. If you’re not social media savvy like our millennial friends, social media data can seem like a foreign language. Well, I’m here to tell you not to worry, we will be looking at big picture ideas and metrics. You got this—let’s just jump right into it!
In this blog post I will be covering:
1. What to Review
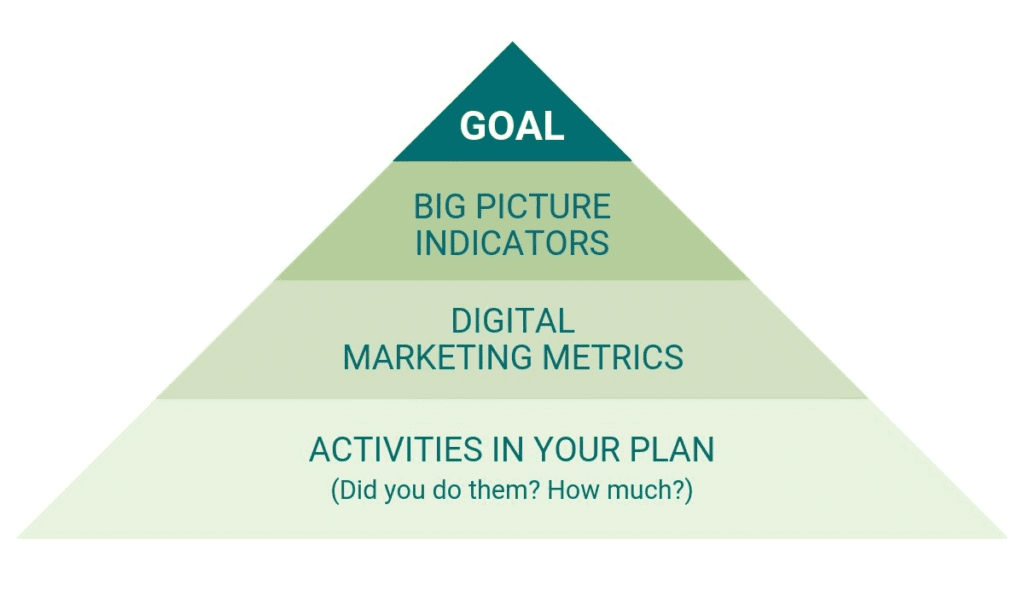
Like we explained in our first part of the series, Digging into Data Part 1 – Reviewing Website Data, in this step we would typically go over the marketing data review—pyramid style! Our in-depth overview blog post, Reviewing Your Digital Marketing Data to Make Decisions, covers four layers of the digital marketing review pyramid and helps you connect your goals and actions.
Determine your Key Metrics before you start reviewing
The key metrics are your success indicators. If you just go into the interface to review your metrics and have no idea what you’re looking for it’s either an overwhelming or possibly an amazing yet time-consuming journey.
The key metrics I look at for my social media accounts are:
- Engagement
- Page Likes/Follows
- Number of Posts
- Reach/Impressions
- Social Website Traffic
Now remember, I’m an art director, business owner, and CEO. So I look at big metrics. I may review what types of posts do well but I don’t dig into every post. I trust my social media peeps to do that. I’ll talk a bit about where you can find data. But I’m more concerned that you as a business owner can make a decision about if your marketing is working with these reviews, not so much what to post about next.
2. Tools that Make it Easier
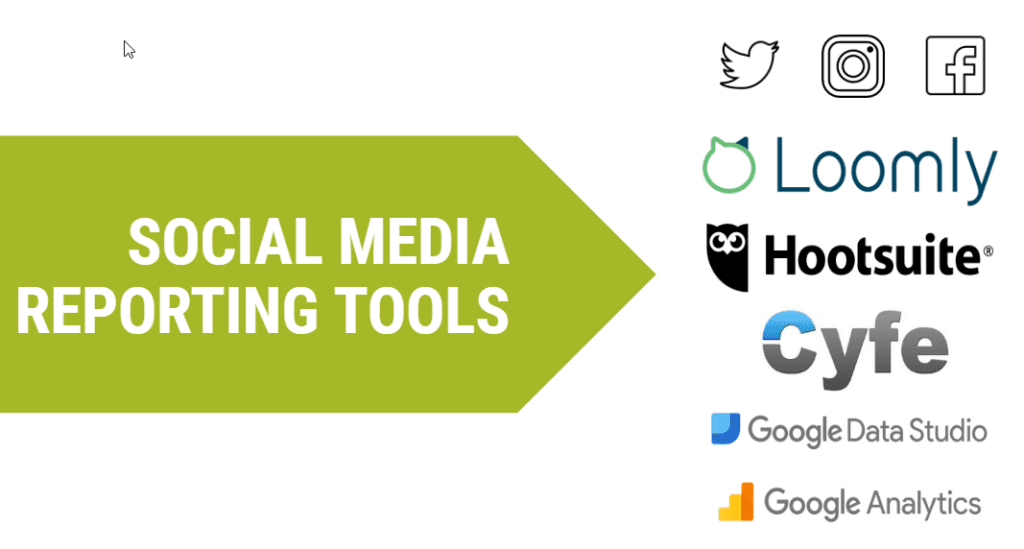
Loomly and Hootsuite
Loomly publishes our social media posts and gives us big picture analytics. It helps me diagnose how every single post performed. Another similar service we’ve used in the past is Hootsuite.
Both Hootsuite and Loomly have their own strengths and weaknesses. Just because we use Loomly doesn’t mean it’s the end all be all for social media planning and reporting. Hootsuite is super robust too and there’s so many other ones out there.
If you’re going to do more than one type of social media, it just makes sense to publish it using a tool like Loomly or Hootsuite because then all of the reporting comes in the same interface and it’s a lot easier to get your information quickly.
Cyfe
I also use a dashboarding software called Cyfe which allows me to connect with the social media platforms and report data in a dashboard. I really like it because it sends out a PDF to my clients and tells them what happened over the last month. And it gives a nice big picture overview and tells me some of the things Loomly doesn’t.
Google Analytics and Google Data Studio
Two other services I use to further diagnose how social media accounts are doing are Google Analytics which tells me how the website is acting and then Google Data Studio, which allows me to super easily generate a nice dashboard report of the website data. Then I’m able to sort it very quickly to just look at the social media traffic. You can sort to just look at social media traffic in analytics if you know how. However, it’s so much more user friendly in Google Data Studio.
Want to try Google Data Studio yourself?
I created a sample Google Data Studio report you copy and integrate in your own Google Analytics and search console data with so you can have an easy to use interface to look at your social media traffic and how it behaves on your website. Now, I have tried so many ways to make Google Data Studio talk to Facebook and Twitter and other non Google data sources. You can pay for services to get them to connect. You can also export all your data out of your social media platform and put it into a Google Sheet and make it display in your Google Data Studio.
Video Tutorial – How to Connect Data Studio to Google Analytics and Search Console
BE IN CONTROL.
So those are the tools I use to make my life easier as I review social media data, whatever tool or method you use is perfectly awesome. Just make sure it’s something that makes you feel like you’re in control of what’s going on. And it’s not taking you forever, because if it takes you forever, you’re just not going to do it, at least if you’re anything like me.
3.What Each Item Means
You’re going to look at engagement, your page likes and follows, the number of posts you made, your reach and impressions, and the social media website traffic. Now, these might be the right metrics for you, maybe you need to look at other things. What you need to ask yourself is, what problem am I trying to solve through doing my social media? And then how can you measure that? So go back to your goal and consider what problem you’re trying to solve through doing your social media so you can list that as another metric as you review your social media.
Engagement
The first one I listed was engagement. Engagement is listed first because it’s your most important metric. It tells you if your message speaks to your audience and it can also indicate if you’re speaking to your audience too frequently or not enough. Engagement rates are going to fluctuate based on your strategy and creative. It’s the most important metric because it tells the social media algorithm your content is useful.
When people engage with your content, their friends and followers are more likely to see it and that puts your brand in front of more people. That’s considered viral reach. And think of it as word of mouth advertising. So ask yourself, what’s your engagement percentage? You’re going to shoot for ten with a minimum of seven.
Reactions mean, “This is cool. Thanks for sharing!”
The more people engage with your content, the more likely it is to show up in their newsfeed. Every time somebody interacts with your content, it strengthens your relationship with that person. That’s why you see so many posts from your friends and the people you interact with the most. They’re up at the top of your feed because you’ve shown those people are the ones you care about the most and it’s the same thing between companies or groups and people. The more you have people interact with your content, the more likely they are to see it again, and the more likely their friends are to see it as well.
Comment
The strongest form of engagement is a comment. People commenting on your post means more to Facebook than if they shared your post or liked it. But ultimately, all of the interactions are super valuable.
A comment means, “This is interesting and I have something to say about it. I want to interact with you.”
Share
They could share or retweet your content.
Share means, “This is awesome; everyone should read it.”
Clicks
Now a click could be on anything. It could be on a link, a picture, it could be on the link to your Facebook page. So when you look at clicks metric, don’t think oh my gosh, look at all these people who went to my website because that’s not what it means. It means the number of times people clicked somewhere on your post or somewhere on your ad.
Clicks mean, “I’m checking you out!”
Convert post likes into page likes.
Now, the other cool thing is if you’re on Facebook, you can convert post likes into page likes or follows because Facebook business pages allow you to ask people who’ve liked your posts to like your business page. Asking them only has a 15 to 20% chance of success. So your mileage is definitely going to vary, however, I mean, how cool is it you can go out and make an ask after somebody has interacted with your content? Very cool.
What if your engagement rate plummets?
If you have good engagement, you will have more impressions, you will have more reach, and you will have a continually growing following on your Facebook page. It is the number one metric that matters.
Now if for some reason your engagement rate just plummets. The first thing I want you to do is just take a deep breath because you’re fine. What you probably did was you boosted a post or you ran an ad. On certain platforms like Facebook, they gave you your overview metrics of all of the stuff you do on the platform. It’s not just your organic traffic. There have been times where I look at a client and I say, I can’t figure this out. You guys always have so many people interacting with you. And this month, nobody seems to care about you at all, but all your posts seem to be doing okay, what’s going on? And it turns out they ran a jobs ad. And so they were promoting an employment opportunity. I didn’t know about it and it took me a while to find because I wasn’t aware of it, right.
So if your engagement goes down, it’s likely because you put money behind your content and a bunch of people who don’t know you saw it, and those people are less likely to interact with your content than the people who you regularly post for. And there’s nothing wrong with that unless the thing you paid for, didn’t do its job and nobody saw it or interacted with it. But ultimately, putting money behind your content on Facebook by running an ad or by boosting a post will lower your engagement rate overall, and it’s okay.
Page Likes/Follows
Now the next thing you’re going to look at is your following. Page likes or follows, either one. Is your following growing continually? People are going to unlike you, and it’s not bad. What you shouldn’t have is more people unliking you than liking you. The goal here is continual progression.
If you have good engagement, you will continually get more likes, which is why my social media people tell me, I don’t even know why you look at that. It’s stupid because engagement is what really matters. But I report on this because it is a very tangible metric and is an outcome of good performance.
People are “unliking” you.
If you see a bunch of people unliking your page, it can be an indicator of what you’re posting doesn’t resonate with your audience or maybe you’re just posting way too frequently. I regularly see pages with two to four unlikes a month. It’s so natural. And if the page is behaving in a healthy way, it’s okay. You really just want people who want to see your content, you don’t want the people you’re not actually building a relationship with anyway. So a healthy page should always have an uptick in likes and it’ll have a few unlikes. Don’t freak out about it.
Real followers are ALWAYS better than fake followers.
We’ve taken over social media accounts who have thousands of followers like 6,000, 7,000 followers, but every single time we post, it’s only seen like 50 times and it’s because they’ve got a bunch of people who liked the page, but didn’t actually like the page. It’s just a bot. It’s crap and it’s way harder to revive and get people to interact with your content because you already showed those social platforms you suck. Basically, it’s easier to just start fresh than it is to have a whole bunch of people who are just ignoring you and telling the algorithm all your posts are terrible.
Likes VS. Followers
On Facebook, you have both likes and followers. And the difference between those two is a like is hey, you’re cool. A follow is please tell me about you in my newsfeed. You want follows.
Number of Posts
So the next thing I look at as a manager is how many posts did we make. I have a contract with each one of my clients to make a certain number of posts every month and I want to make sure we did it. And then I look at what type of posts did the best. I want to see if it was a video or a picture or something my client posted themselves because those are indicators to me of things we might consider doing more of in the future.
There are some posts that will naturally get better engagement than others. Facebook, for example, considers every time someone watches a video, an engagement with your video. Video posts take far more energy to create, but they have a naturally high engagement property. So those tend to go great, but people don’t comment on them as often.
So each type of content you might or might not post has its own little set of quirks with it. And as you keep watching your metrics, you will find them repeating. You’re just looking for patterns as you’re reviewing your marketing data. It’s just a big pattern. Watch and when you see the patterns that are good, you keep making those patterns happen. When you see the bad patterns, you don’t do them again.
Reach/Impressions
Next up, you are going to look at reach and impressions. So impressions are really the easiest to understand of the two, it’s the number of times your content was viewed. Reach is the number of unique views. For example, if I make a post, and it’s seen by 20 different people, that post has a reach of 20. If each of those people saw the post two times, then the post has 40 impressions.
On a post level, those metrics can seem very straightforward. When you look at the overall reach, however, it’s adding the reach of every single post together to give you your total reach metric. So if 20 people saw a post and the same 20 people saw another post, then your reach is 40. But you didn’t actually reach 40 different people. Your content itself had 40 unique views. I’m sure that’s just like completely clear to you, right?
Another confusing thing about reach is it’s not just people, it’s the number of people or unique devices who saw your content. So I could see your content on my desktop computer and on my phone and I would be counted as a reach of two, even though I’m the same person. The system doesn’t understand my phone and my computer are the same person.
Viral Reach
Now, viral reach is awesome. It means they’re outside of your normal following and they saw your content. To old school marketers impressions makes a ton of sense. So it’s the number of times your content was seen. This is it’s like the number of sessions on your website or the number of times someone opens a magazine. Viral impressions are also great because they’re people seeing your content that are not inside of your normal following—it’s generally a result of great engagement.
Social Media Website Traffic
Your website always gives another layer of data for each digital marketing activity you do. For example, if you do social media, you can review how many times your posts were shown and how well people interacted with them. If you post 20 times a month and no one engages with them, you’re probably posting crappy stuff.
What to Look For
Now, when you go out to your website, you’re going to sort and look at social media traffic only. Here are the metrics you should look at and what they mean:
Use UTM Parameters
Put UTM parameters on your links in social media for any paid traffic to make sure you can tell what traffic you paid for and what came organically. You can add this on to Facebook ads or just build your own UTM parameters:
4. How Often to Review
Make a commitment to your marketing, decide how often you’ll review. Not everything will need to be reviewed at the same frequency. I like to look at things like online ads weekly or bi-weekly, while I look at things like social media, email list growth, and sales monthly.
When you begin reviewing your data, it’s hard to know what’s good and what’s not, because every campaign is different. Look at a month-over-month comparison and a year-over-year comparison of your metrics when you review results. You won’t always see improvement month-over-month due to seasonal services and fluctuation in marketing activities. That’s why reviewing your year-over-year is important. Unless you completely stopped marketing, you should generally see improvement year-over-year.
Pro Tip 💪
Try not to do a ton of week-over-week review. Unless you’re engaged in a huge marketing push, it’s difficult to compare week-over-week with such a limited amount of data.
Feel like a social media guru yet?
I hope you can take the things I talked about today, and use them to make purposeful decisions using your social media marketing data. We covered what you’re going to review, the tools you can use to make it easier, how to interpret those metrics, and how often you need to review it. Make sure to check out our other blog posts in this three-part series, Digging into Data: Reviewing Your Website, and Digging into Data— Reviewing your Email Data (coming soon).
Who Manifested This Madness?

This fabulous human, that's who.
Monica Maye Pitts
Monica is the creative force and founder of MayeCreate. She has a Bachelor of Science in Agriculture with an emphasis in Economics, Education and Plant Science from the University of Missouri. Monica possesses a rare combination of design savvy and technological know-how. Her clients know this quite well. Her passion for making friends and helping businesses grow gives her the skills she needs to make sure that each client, or friend, gets the attention and service he or she deserves.


")