
Digging into Data Part 3 – Reviewing Email Data
November 12, 2020

CONSUME CREATIVELY
This content is available in:
AUDIO
TEXT
The most important aspect of email marketing is actually sending the darn email! But once you’ve done that a few times, now what?
Review your metrics!
This is nothing new to you, right? Because we recently talked about reviewing your website data as well as reviewing your social media data. Well, in true form, we’re now going to go through what to review for your email marketing, which also includes tools to make your reviewing easier, how to interpret your metrics, and how often to review.
I find that people just straight up ignore their marketing data because they’re uncomfortable with it. They don’t know where to start. They don’t even know what metrics mean, really. So we planned this series of posts/podcasts to empower marketers and business owners to lean into their marketing data.
If you’re one of those people who feels like you’re just flushing your money down the toilet with your marketing because you don’t even know what’s working and what’s not, you’ve come to the right place.
Let’s dig into the four things that you really need to know to get control over your marketing data.
What to Review
Now just a quick reminder, we are reviewing your marketing data, pyramid style.
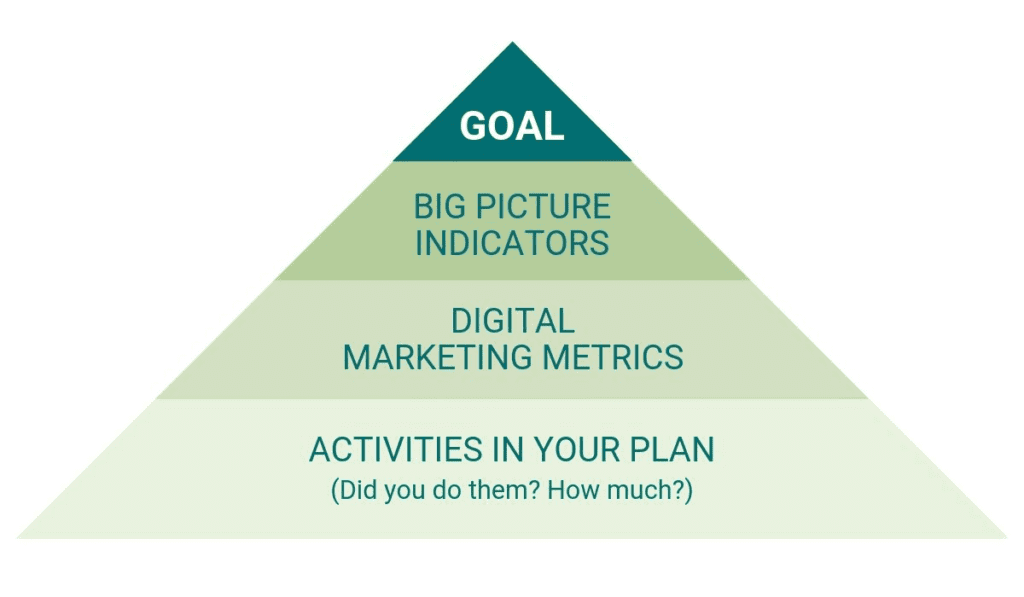
At the bottom is your plan: all the activities that you’ll execute to implement the marketing plan, asking yourself questions like, “Did you send your emails?” At the narrow top is the end goal of your campaign — that defines your most important metric. For most people, it’s going to be increasing sales.
As you’re reviewing your emails, you want to make sure you ask yourself, did you send them? How did they work? Those kinds of questions make up the middle of your pyramid. At the top of the pyramid, it’s, did you sell anything from your emails?
Determine your key metrics.
Those key metrics are going to be your success indicators. If you just go into the interface to review your metrics, and you don’t have any idea what you’re looking for, it’s going to be really overwhelming. It could possibly be an amazing journey, but it’s going to be also really time-consuming, so it’s important to know what to look for. I’d say though that of all of the reviewing interfaces we’ve looked at, email data review is the least overwhelming, so you’ve got that going for you.
The first major indicator of success for email marketing is just sending the email. Once it’s time to review how it did, you’ll first look and see if people opened it and if they clicked on your offering, and last but not least, did they do what you want? Have them to do on your website. So
There are a lot of components you can review and tweak based on what you find — from the subject line to the content in the email, all the way down to the landing page content.
We’ll look more closely at website traffic later on, but first let’s focus on the analytics you’ll find in your email software. As the Art Director/Business Owner, I look at the big metrics the most often and use those key metrics to determine the quality of the subject lines or link usage in the actual email.
I seldom look at who exactly opened the email or on which day or time they opened it — because that’s something Katie, my email implementer, would do, or whoever is set to receive responses to those emails. If it’s a sales push, it might be one of your salespeople. If it’s an account service push, it would be one of those people.
Tools that Make it Easier
With so many other things that we’ve spoken about, it’s no surprise how many tools are out there to make your email data reviewing easier.
Email Software
MailChimp has a very robust reporting analytics interface — it’s great. Disclaimer: others may not be this great. We also have an account with Emma, and they also have a really detailed reporting software. Both of them go through so many metrics you won’t even know what to do with them all.
You can send an email through platforms like these, and let’s say that you’re doing a sales push, and you’re making it to your past clients. So you can send these emails and then you can go back in and look at the data and see exactly who opened them or who clicked on them. That can help you as a salesperson to know who you should follow up with.
What Your Metrics Mean
The key metrics that I look at for my email marketing accounts are:
- the number of emails that are sent
- the email list size / list growth rate
- bounce rate
- open rate
- click-through rate
- email website traffic
Number of Emails Sent
What I mean by this is, how many emails did you send in the given time period you’re reviewing for? I keep saying it’s important because this number can skew your data one way or the other.
For instance, if you send five emails or 50 emails, there’s a difference in the amount of activity that comes from those. And if you’re looking at your data over the course of a month, you could get much different data back for each.
Email List Size / List Growth Rate
Your email list size is how many people are in your email list. List growth rate is a measurement of how fast your email list is growing, which is a really nice piece of data to have.
To calculate your list growth rate, you take your new subscribers and subtract from that your unsubscribes and your hard bounces. Then take the difference and divide it by the size of your list, which should give you a percentage.
LIST GROWTH RATE = (NEW SUBSCRIBERS – UNSUBSCRIBERS – HARD BOUNCES) / LIST SIZE
Your list growth rate is a sign of whether or not your email campaign is healthy. The average lifespan of an email address is only around 18 months…the age of a toddler…and the average turn rate of an email is 25% annually. What that means is emails go bad over time, whether it be because of a job change or forgotten password. Why does this matter? Because it’s important to add new subscribers to your list to replace the ones that you’ve lost.
Story Time
We learned the hard way at MayeCreate the importance of implementing something that will help grow your list. When we launched our new website a couple years ago, we somehow overlooked a part of our online marketing process and didn’t discover the oversight until we went to review our marketing data. We saw our list growth wasn’t just plateauing, it was steadily declining.
Why? Because we realized we didn’t have an email signup form ANYWHERE ON OUR WEBSITE. What?! Yeah, being human is hard sometimes.
Bounce Rate
The bounce rate is the percentage of total emails sent that could not be delivered to your recipients inboxes. This metric includes hard bounces and soft bounces.
Hard Bounce
Hard bounces are emails that are permanently undeliverable, which could be because there’s a non-existent address or a closed email account, or even a misspelled email address.
Soft Bounce
A soft bounce is an email that gets to the recipient’s email server but couldn’t be delivered. You could encounter a soft bounce if the recipient’s inbox is full or if the server is overloaded, if your message is too big, or if it’s spammy – don’t spam, by the way.
To calculate your bounce rate, take your hard bounces and divide those by your list size.
BOUNCE RATE = HARD BOUNCES / LIST SIZE
Bounce rates vary by industry and list size but ideally should be under 5%, if possible.
The bounce rate measurement sets the stage for your email campaign success or failure, because if you can’t get your messages to your recipients, they won’t be able to click on anything in it or read any of the cool words that you wrote.
Getting a high bounce rate?
Two reasons why bounce rates can be really high:
- If you buy or you borrow a list from somebody, you would could have a really high bounce rate because they might not be accurate emails.
Don’t do this. Those people didn’t agree to receive your email, ya know? It’s just a little gross, is all… - You just haven’t sent an email out in a while.
Open Rate
Your open rate is the percentage of recipients who opened and looked at an email. What’s nice about this metric is it essentially shows you how much your audience cared about your email.
To calculate your open rate, take your emails sent and subtract bounces from that, then you take your emails opened and divide it by the difference of your emails sent and bounces:
OPEN RATE = EMAILS OPENED / (EMAILS SENT – BOUNCES)
Your open rate is influenced by a number of factors, namely what industry you’re in, the inclusion of images in your email, and your subject line, so it’s not always a true measure of your success in terms of your email campaign.
Industry
On average, an open rate for a campaign can be anywhere from 20 to 40% — According to MailChimp’s email marketing benchmarks, if you’re in the construction industry, you probably have an average open rate of around 22%. If you’re in marketing, it’s around 17%. Nonprofits get open rates closer to 25%. Look at the industry benchmarks to know what to aim for when tracking and tweaking your emails, even if you’ve been email marketing for a while. It’s a good guiding compass to keep you on the right track. Campaign Monitor also has their Ultimate Email Marketing Benchmarks for 2020 by Industry and Day, which is pretty amazing.
Images
If you don’t include images in your emails, then you can’t measure your open rates.
Huh?!
Yeah. Get this: when an image downloads, that’s when an email is counted as opened. Not only that, some mobile devices read email in text format only, so it’s very probable that some people will open your email, but you won’t see those opens in your data.
Subject Lines
The subject line’s gotta be a good one. If anyone cares about it, they’re going to click on it. Most email platforms out there let you test out different subject lines by sending out a batch with your variances to part of your audience, then depending upon which one behaved better, it will send your email with the best performing subject line to the rest of your audience.
Click-Through Rate
The click-through rate is the proportion of subscribers who clicked on one or more links in an email message. Yeah, it’s a really easy metric to calculate. It’s just your total number of clicks divided by your emails delivered:
CLICK THROUGH RATE = TOTAL NUMBER OF CLICKS / EMAILS DELIVERED
The click-through rate can help you determine if your email is relevant. If the message you’re using is compelling to the recipient, they’ll ideally take some kind of action. These rates can differ greatly by the type of email you’re sending, so it is important to compare your click-through rates based on your email types.
For instance, transactional emails (“Thanks for your order!”) have super high click-through rates, especially for Mayecreate because we send emails to visitors who download something on our site that include the offering download link. But if we’re sending out a promotional email about a new marketing venture we’re doing, our click-through is not as high because the goal and messaging for that email is very different.
If your click-through rate is low…
Ask yourself first, “Did I include a link in the email?” I know it sounds insane, but sometimes you might forget. So, ya know, just make sure you did… Having a couple text links is a really good way to make sure that you do have people clicking through. I say text specifically because, again, if people are using their phones to check email and you’re linking an image, those people aren’t going to see your image, so that’ll make your click-through rate far lower. And let’s be real with ourselves, a lot of people are checking their email on their mobile devices, especially their personal email. So pay attention to those things.
Website Data – Google Analytics
Your website data gives you the opportunity to review how many visitors come to your website because of your email and how they interact with the content once they’re there. If people are opening your emails and they’re clicking through to your site, then you’ve got the email creation part down. But if they’re not staying on your site to read or interact with your content, then your website is where the problem lies.
A high click-through rate with a low conversion rate most likely means there’s something wrong with your landing page. The challenge, though, with tracking visitors that arrived on your website by clicking on a link that’s inside of an email is sometimes Google Analytics recognizes that traffic as coming from an email, and other times, it recognizes the traffic as coming from a referral source, usually when people are clicking from a webmail address. So you get it mixed in two different places in email and in referral sources.
Make sure you’re tracking in MailChimp!
If you’re sending emails through MailChimp, there is a box that you have to check enables Google Analytics tracking so you can properly track each campaign. First, you have to hook up your Analytics account with MailChimp, and then for each email that you send, you check the tracking box (or else it’s not going to record that it was part of that email campaign) and name it whatever you want. If you don’t label it, it will come back with a string of letters and numbers and you will have no idea what it is…. MAILCHIMP_AUTOMATION_01 or something like that.
What to Look for in Your Analytics
When you’re in Google Analytics, you only want to look at the traffic that came in from email, so first thing, sort your visitors by email traffic.
Once your traffic is sorted, you can examine a number of metrics to see how they’re interacting with your website:
Sessions
This lets you know how many people actually arrived at your site because of your email.
Time on Site / Pages per Visit
These two things are going to tell you how people behaved on your site. ou want time on site and pages per visit to be pretty close to if not better than the way people behave when they come from organic search because those organic visitors are usually the people who are out seeking knowledge and looking to make buying decisions, they came to your website because they searched for something that brought them there. So they came up with their own accord. If people get to your website, and they’re not spending hardly any time on the page, and they’re not going to any other pages, that means that the content that you’ve provided them either is misaligned, and it doesn’t deliver on what they thought it would. That’s not good, because we wanted them to go and take action.
Device
There are so many people checking their email on a mobile device, and if people who are clicking through from your email to your website aren’t behaving well once they’re there, you might want to look at that landing page and see what it looks like on a mobile device. On the flip side, you can see how much email traffic comes from a mobile device and use that information to ensure your emails look really good on mobile.
Most email marketing software allows you to preview your emails for mobile, so be sure to take advantage and adjust your layouts as needed for mobile screens.
Events/Conversions
If you have conversions or events set up on your website, you’ll want to look for which email brought in the most conversions. If you have dollars attached to your conversions, you can see which ones are creating the most revenue on your website.
We definitely rely on this metric when we go to review email conversions from the emails we send for CoMoGives in December. Without it, we’d never know the emails we send out on behalf of CoMoGives generate the most donations of all the online marketing activities we do for the campaign.
Most Viewed Pages
I don’t necessarily look at this metric every time I review our email data, but occasionally, I look at what the most viewed pages are on my site from email traffic.
Did they just go to the links you gave them, or are they going to more pages on your site? Which pages are they going to? With this information, you can get a picture of what these visitors are after. For instance, if they’re only going to the one link that you gave them, it’s possible you didn’t offer them any other options for where to go on your site.
Sometimes when you send out an email and you’re asking somebody to buy, they’re not ready to buy, right? No big surprise. But if you give them other steps that they can take, like downloading a free guide or reading a blog post on your site, they’re more likely to visit other pages on your site.
How Often to Review
This can often depend on your campaign goal or length.
If you’re doing a marketing push…
When we’re asking people to take action like sign up for a webinar or make a donation, we’re looking at the numbers pretty often. If you’re going to send out another email on the heels of your first one, you’ll certainly benefit from knowing how the first one did so you can tweak the following emails, right? If you look at it right after you send it, you’re gonna miss a lot of action because not everybody opens the email immediately.
If you’re sending weekly or monthly newsletters….
For regularly sent newsletter emails, you can set a monthly or quarterly review calendar event to see week-over-week or month-over-month how your emails are performing. At MayeCreate, we have our newsletter emails automated to send out weekly to our blog subscribers and monthly to our clients, so we look at all of that together each month.
If you’re brand new to all this…
It’s not a bad idea to keep a closer eye on your metrics when you’re new to all this so you can get a feel for your audience and your industry benchmarks. Take the opportunity to experiment with your subject lines, frequency, and landing pages and track, track, track to get a better idea of how you’ll run your next email campaign.
No more excuses!
You now have what you need to review your email marketing:
- What to review
- The tools to make it easier
- How to interpret your metrics
- How often to review
Now’s also a good time to take this email-data mindfulness and revisit our posts on reviewing your website and reviewing your social media data to see if you can make better sense of some of the concepts we shared with you.
Happy tracking!
Who Manifested This Madness?

This fabulous human, that's who.
Monica Maye Pitts
Monica is the creative force and founder of MayeCreate. She has a Bachelor of Science in Agriculture with an emphasis in Economics, Education and Plant Science from the University of Missouri. Monica possesses a rare combination of design savvy and technological know-how. Her clients know this quite well. Her passion for making friends and helping businesses grow gives her the skills she needs to make sure that each client, or friend, gets the attention and service he or she deserves.


