3 Ways to Celebrate Your Nonprofit’s Impact on Your Website
December 17, 2025

CONSUME CREATIVELY
This content is available in:
TEXT
You know your work changes lives. But potential donors don’t have the same insight. If they land on your website and don’t get excited about your nonprofit’s work, they may keep scrolling.
Here’s the thing: You have amazing impact data telling the story of your nonprofit and its community. It’s time to put that data to work!
Measuring your impact and sharing that data on your website lays the groundwork for educating visitors about a community need, driving action through donate buttons, and otherwise turning your audience into involved supporters.
Let’s explore the steps your team can take to celebrate impact on your nonprofit’s website and build stronger connections with its community.
Table of Contents
1. Use data visualizations.
Your nonprofit’s social impact is made up of many key metrics — we call them key impact indicators (KIIs) — that measure how your activities are performing against your goals. For example, you might track the number of beneficiaries a program serves versus the size of the community facing the need.
But let’s be honest: pages of raw data and complex numbers drift between a little dull to hard to interpret. Sharing this information in a visually engaging way is the best way to capture your website visitors’ attention.
Data visualizations translate your KIIs into charts, infographics, and other illustrations that make patterns and insights easier to understand. Here are a few examples of website elements with high visual appeal:
Dynamic Impact Dashboards
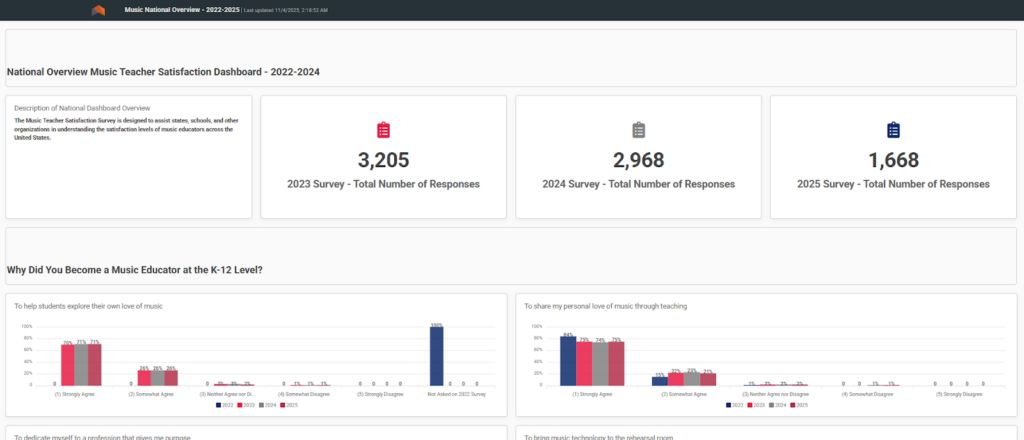
A well-designed dashboard transforms your website from a static brochure into a live, interactive report. Use dashboards to highlight metrics related to the top priorities your nonprofit aims to address, the work you’re actively doing, or your results so far. Website visitors can explore the data themselves, filtering to view the metrics that interest them.
For example, visit the website of the National Federation of State High School Associations (NFHS), and you’ll find links to dashboards that illustrate the organization’s national research on music teacher satisfaction.
As an advocate for fine and performing arts, featuring this transparent data directly on their website provides mission-critical insights to their supporters.
Real–Time Data Counters
Imagine you’re marketing a crowdfunding campaign, and you share that you’ve received 100 donations. That figure could change dramatically within the hour, making your update instantly outdated.
The same is true of certain impact metrics. For example, a national youth literary program could see 10 new enrollments each hour, or an animal shelter might facilitate five dog adoptions every day. These numbers add huge value to your website, and they’re most meaningful when they’re up-to-date.
Consider setting up a live-updating counter powered by your data platform to share your most important metrics. Embed it on your website’s homepage or in other prominent locations that receive the most traffic, especially the pages that new visitors are likely to browse, such as your About page.
Progress Trackers
While impact data is engaging on its own, visitors will feel a deeper sense of meaning when those numbers are framed by your nonprofit’s goals. Make those real-time data counters even more powerful by comparing these figures to your mission-driven objectives.
For example, you might use visualizations like progress bars or fundraising thermometers to display:
- Current program outcomes compared to your nonprofit’s annual goal
- Fundraising progress in a campaign that’s directly tied to serving beneficiaries
- The reach of your programs and services compared to the size of the community you serve
- Financial insights, such as a reduction in overhead expenses in light of your nonprofit’s budget
This powerful data doesn’t just celebrate your team’s hard work—it shows evidence of your organization’s effectiveness.
2. Combine your numbers with real-life stories.
Impact data is more than just numbers (like how many people you served or dollars you raised). It’s a compelling mix of those statistics and the authentic, human stories of the people you help.
However, connecting the dots between your organization’s efforts and the real-world outcomes isn’t always easy. To do so, you need a blend of:
- Quantitative data: The numerical results, like program enrollment counts or fundraising totals
- Qualitative data: The descriptive details, such as testimonials, stories, and quotes
Here are some steps you can take to combine the two types of data and incorporate them thoughtfully throughout your website:
Consolidate your data to find your story.
Whether you’re creating an impact report to display on your website or just using its insights to add meaningful data to each page, the impact reporting process is helpful in consolidating and using all types of data.
Start by using impact reporting tools, like UpMetrics, to gather data, determine what it means, and share your results. These tools make it easy to consolidate and analyze data, so you know exactly which numbers and stories to spotlight on your website. Even better, these tools can deliver insights that help you make informed decisions to keep pushing your mission forward.
Choose creative ways to display your data.
Qualitative data is descriptive, making it difficult to put into charts or graphs. However, there are numerous ways you can pair it with your numerical insights on your website—you just have to get creative!
For example, a dedicated “Impact Stories” page could serve as a hub for short, engaging narratives. Supplement each story with high-quality photos, including infographics or graphs to incorporate numerical data.
Or, pair quotes and testimonials with your real-time data counters and progress trackers. For instance, next to a counter showing the total number of high school students enrolled in your literacy program, include a quote from a participant talking about the difference the program has made in their life.
3. Structure your content around recognition.
Your impact data is a direct reflection of the outcomes driven by donors’ involvement. What better way to express your gratitude for supporters than by calling out their generosity on your website?
Recognition not only helps your nonprofit retain supporters but also explains what made your impact possible. Think of it this way: Impact data explains the “what” and “why” because it details your nonprofit’s efforts, why they’re needed, and what they achieved. Recognition provides the “how,” because it highlights the supporters who helped make it happen.
Attribute your insights to the efforts of everyone involved in achieving impact, including:
- The staff who deliver your programs
- Corporate partners who sponsor your work
- Grantmakers who invest in your mission
- Individual donors who contribute to various campaigns
- Volunteers who donate their time and talents
For example, notice how the Atlanta Humane Society ends a success story about a dog who was temporarily cared for in a loving foster home while his owner was unemployed and unable to financially support her pet. The conclusion reads, “This kind of support is only possible because fosters and donors step up for pets and the people who love them.”
Impact data is an invaluable asset for transforming your website into a powerful tool for fundraising, reporting, and advocacy. Start by auditing your website to see where it stands. Identify the pages most fitting for your impact data, then plan ways to thoughtfully incorporate it to engage your audience.
Connect with Cait
Who Manifested This Madness?

This fabulous human, that's who.
Cait Abernethy, Director of Marketing at UpMetrics
GET MORE AWESOME
If this trips your trigger you'll love our podcast. Get more episodes just like this on:

You'll Probably Also Dig


Time to get your act together. Start with a conversation.
573-447-1836 | info@mayecreate.com

Our Podcast
What to Put on Your Website

A free page-by-page website content checklist.