Google Analytics: Key Indicators for Measuring Website Success
June 24, 2014

CONSUME CREATIVELY
This content is available in:
TEXT
“How did you hear about us?” We’ve all heard this tired tracking question employed by so many companies to discover how they gained a new lead or customer. The method is flawed at best for tracking customer acquisition. Perfecting the art of tracking is a full time job but reviewing your online marketing efforts is a fairly painless experience when you know what to look for.
When reviewing website traffic reports with clients we are commonly asked, “Is that normal?” Unfortunately there’s no easy answer to that question, each business is different. However, in our craving for data, we pooled stats from one month worth of web traffic* on 169 sites we manage from various industries and locations. Our intent is to make the data available for discussion purposes or for use as rough benchmarks when reviewing your site’s data. Here are a few key stats to use as indicators when evaluating the success of your website.
Sessions
(Formerly “Visits”)
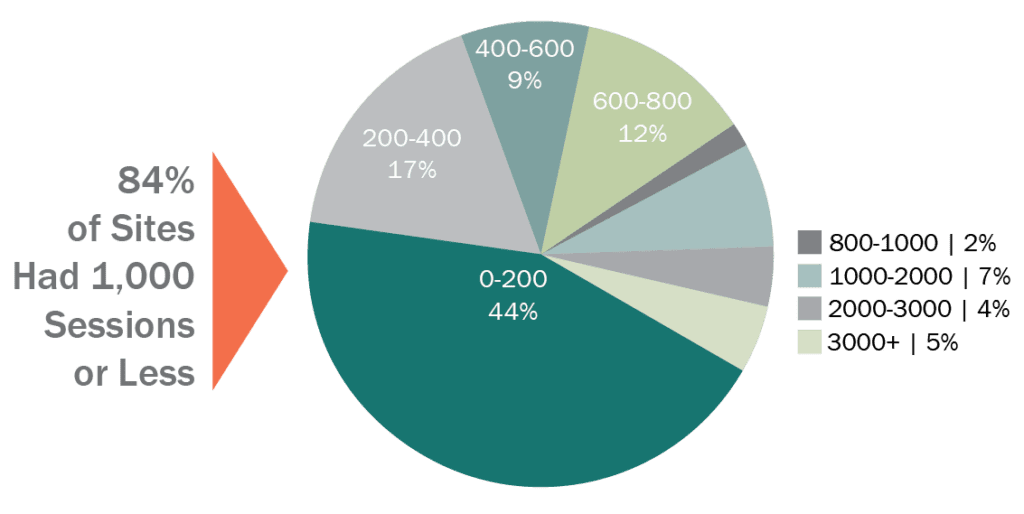
More Sessions are usually better from a marketing perspective; each time your site is viewed represents another opportunity for business. In April this year, Google introduced the term Sessions to replace the metric in Analytics reports formerly referred to as Visits. Each time a user interacts with your site, a Session is recorded. This tells us how many times a site was accessed in a given period of time. Not to be confused with the number of people who saw the site, this term is called Users.
The sites we monitor display a large variance from 3 to 14,884 Sessions monthly. The average is around 660 Sessions per month. Sites with smaller, local audiences generally have fewer Sessions while regional and national sites trend towards more traffic.
Bounce Rate
This metric allows you to analyze the quality of user visits. Higher Bounce Rates can be an indicator of low quality content or design usability challenges. Bounce Rate is the percentage of single page Sessions or percentage of visits in which the visitor only views one page of your website before leaving.
If your site has a high Bounce Rate, investigate the metric on a page by page basis to uncover possible challenge areas. Bounce Rates are generally highest on the Home and Contact pages. Review the keywords visitors are using to find your site. Visitors may be finding your site for the wrong reasons, resulting in a bounce.
For example, in 2009, MayeCreate wrote a blog post about how to use sidewalk chalk as a marketing tool. We experienced a large number of visits to our site from those searching for “sidewalk chalk”, all of which bounced. Since MayeCreate doesn’t sell sidewalk chalk, we decided to remove the post from our blog to ensure the visitors we attract are truly interested in our content.
Average Session Duration
(Formerly “Average Visit Duration”)
This data can lend insight on the level of involvement or engagement visitors have with your content. Sites with short Average Session Durations may suffer from lack of relevant content. The Average Session Duration metric is calculated by dividing the total amount of time visitors spend on your site by the total number of Sessions.
If your site experiences short Average Session Durations, examine the Average Time on Page metric on a page by page basis to diagnose challenge areas. This will tell you where and how visitors spend time on the site. When reviewing this data, consider the amount of content offered on the page or site. If your site is small, offering few pages or a small amount of content, it will naturally experience shorter Average Session Durations than a site with many pages or generous amounts of content.
The sites we monitor experience Session Durations varying from 7 seconds to 12 minutes with an average of 1 minute 55 seconds. Over 70% show Average Session Durations of 3 minutes or less.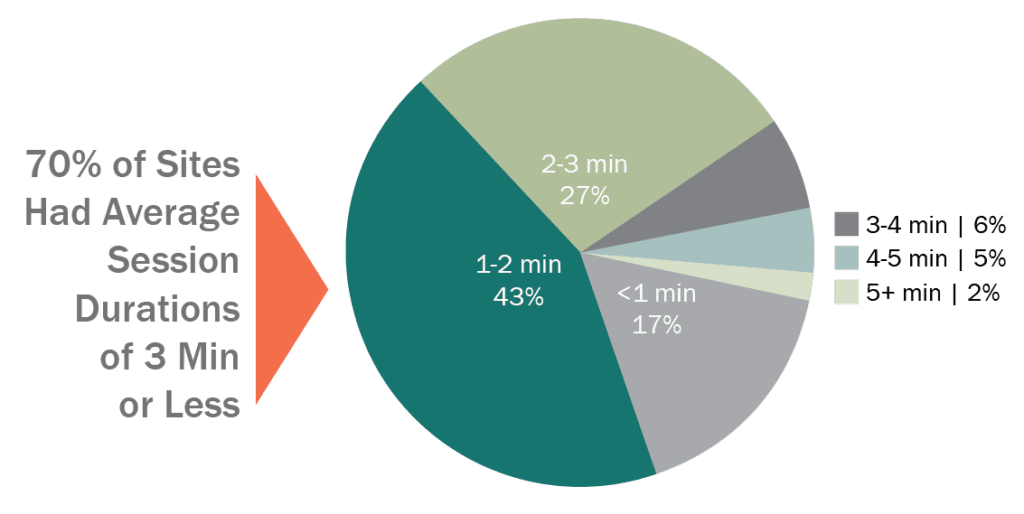
Learn more about what you can expect from your website and how to read your Google Analytics reports in the first of our second semester workshops, Under the Hood of Google Analytics, held in September. You can sign up for a session online at www.MayeCreate.com/Workshops.
DATA DISCLAIMER: The data shared is reflective of 169 websites monitored by MayeCreate using Google Analytics. The data is a snap shot of one month of activity gathered from May 6, 2014 to June 4, 2014. It is not representative of all websites in the world. It is displayed for discussion and benchmarking purposes.
(If you gained awesome knowledge from this blog post, you may also be interested in Google Analytics: How to Add a User.)
Who Manifested This Madness?

This fabulous human, that's who.
Monica Maye Pitts
Monica is the creative force and founder of MayeCreate. She has a Bachelor of Science in Agriculture with an emphasis in Economics, Education and Plant Science from the University of Missouri. Monica possesses a rare combination of design savvy and technological know-how. Her clients know this quite well. Her passion for making friends and helping businesses grow gives her the skills she needs to make sure that each client, or friend, gets the attention and service he or she deserves.